NAR: U.S. Existing-Home Sales Fell 8.4% in January; Northeast Home Sales Declined 5.9% Last Month
Due to low supply, the median home price reached a new high for the month of January.
Housing affordability has been a challenge, but the worst appears to be over,”

WASHINGTON—Approximately 90% of metro markets (196 out of 226, or 87%) registered home price gains in the third quarter of 2024, as the 30-year fixed mortgage rate ranged from 6.08% to 6.95%, according to the National Association of Realtors’ latest quarterly report.
Seven percent of the 226 tracked metro areas recorded double-digit price gains over the same period, down from 13% in the second quarter.
“Home prices remain on solid ground as reflected by the vast number of markets experiencing gains,” said NAR Chief Economist Lawrence Yun. “A typical homeowner accumulated $147,000 in housing wealth in the last five years. Even with the rapid price appreciation over the last few years, the likelihood of a market crash is minimal. Distressed property sales and the number of people defaulting on mortgage payments are both at historic lows.”
Compared to one year ago, the national median single-family existing-home price ascended 3.1% to $418,700. In the prior quarter, the year-over-year national median price increased 4.9%.
Among the major U.S. regions, the South registered the largest share of single-family existing-home sales (45.1%) in the third quarter, with year-over-year price appreciation of 0.8%. Prices also increased 7.8% in the Northeast, 4.3% in the Midwest and 1.8% in the West.
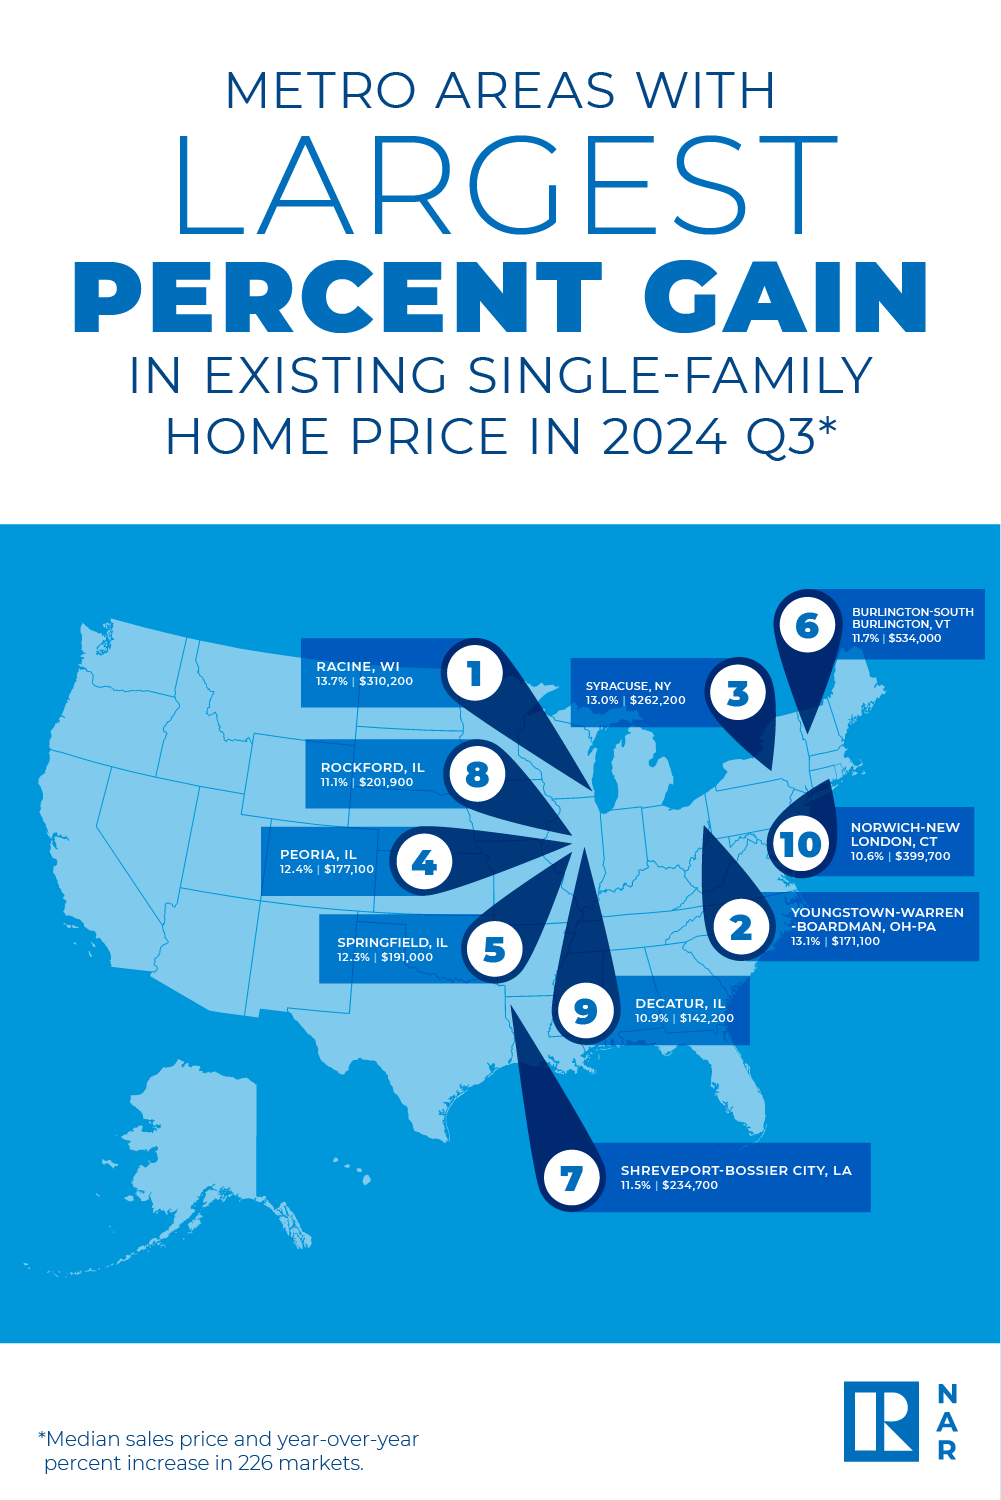
The top 10 metro areas with the largest year-over-year median price increases, which can be influenced by the types of homes sold during the quarter, all experienced gains of at least 10.6%. Four of the markets were in Illinois. Overall, those markets were Racine, WI (13.7%); Youngstown-Warren-Boardman, OH-PA. (13.1%); Syracuse, NY (13.0%); Peoria, IL (12.4%); Springfield, IL (12.3%); Burlington-South Burlington, VT (11.7%); Shreveport-Bossier City, LA (11.5%); Rockford, IL (11.1%); Decatur, IL (10.9%); and Norwich-New London, CT (10.6%).
Eight of the top 10 most expensive markets in the U.S. were in California. Overall, those markets were San Jose-Sunnyvale-Santa Clara, CA ($1,900,000; 2.7%); Anaheim-Santa Ana-Irvine, CA ($1,398,500; 7.2%); San Francisco-Oakland-Hayward, CA ($1,309,000; 0.7%); Urban Honolulu, HI ($1,138,000; 7.2%); San Diego-Carlsbad, CA ($1,010,000; 3.2%); Salinas, CA ($959,800; 1.5%); San Luis Obispo-Paso Robles, CA ($949,800; 6.7%); Los Angeles-Long Beach-Glendale, CA ($947,500; 5.6%); Oxnard-Thousand Oaks-Ventura, CA ($947,400; 2.8%); and Boulder, CO ($832,200; -3.0%).
Nearly 13% of markets (29 of 226) experienced home price declines in the third quarter, up from almost 10% in the second quarter.
Housing affordability slightly improved in the third quarter as mortgage rates trended lower. The monthly mortgage payment on a typical existing single-family home with a 20% down payment was $2,137, down 5.5% from the second quarter ($2,262) and 2.4%—or $52—from one year ago. Families typically spent 25.2% of their income on mortgage payments, down from 26.9% in the prior quarter and 27.1% one year ago.
“Housing affordability has been a challenge, but the worst appears to be over,” Yun said. “Rising wages are outpacing home price increases. Despite some short-term swings, mortgage rates are set to stabilize below last year’s levels. More inventory is reaching the market and providing additional options for consumers.”
First-time buyers found marginally better affordability conditions compared to the previous quarter. For a typical starter home valued at $355,900 with a 10% down payment loan, the monthly mortgage payment declined to $2,097, down 5.5% from the prior quarter ($2,218). That was a decrease of $49, or 2.3%, from one year ago ($2,146). First-time buyers typically spent 38% of their family income on mortgage payments, down from 40.6% in the previous quarter.
A family needed a qualifying income of at least $100,000 to afford a 10% down payment mortgage in 42.5% of markets, down from 48% in the prior quarter. Yet, a family needed a qualifying income of less than $50,000 to afford a home in 2.2% of markets, down from 2.7% in the previous quarter.

Receive original business news about real estate and the REALTORS® who serve the lower Hudson Valley, delivered straight to your inbox. No credit card required.