Data Center Moratorium Bill Floated in Albany
New York State lawmakers have expressed concerns over the environmental impacts data centers may have and also the significant energy needs they require.
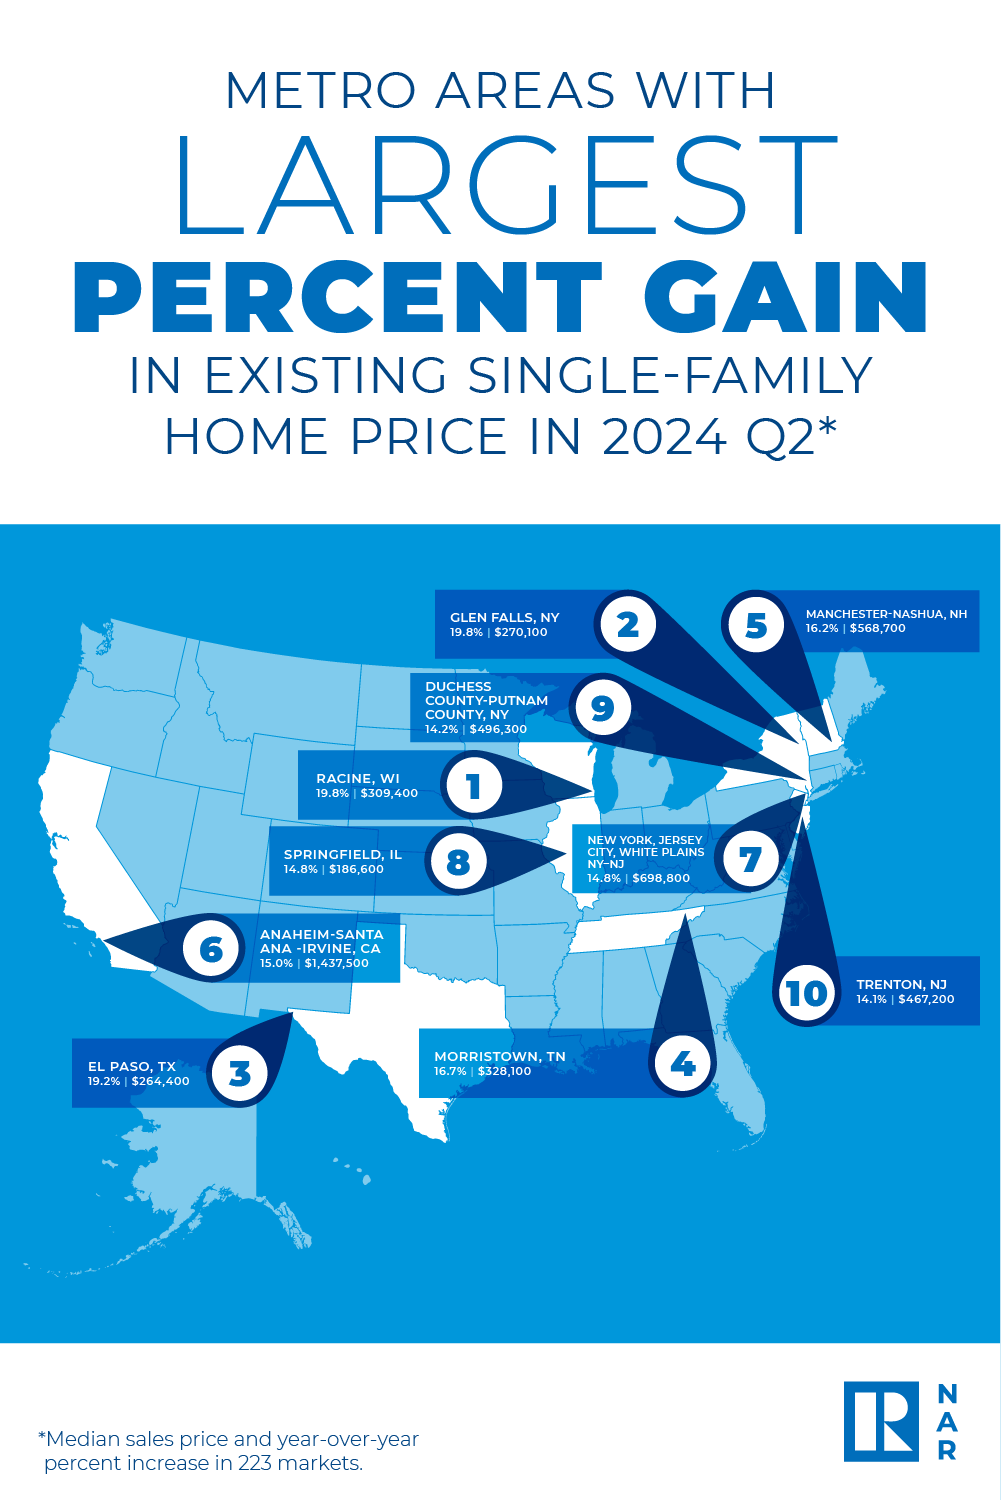
Two market areas that make up the New York metro region—New York-Jersey City-White Plains, NY-NJ (No. 7) and Dutchess County-Putnam County, NY (No. 9)—ranked among the top 10 metro areas for price increases in the second quarter.

WASHINGTON—Almost 90% of metro markets (199 out of 223, or 89%) recorded home price gains in the second quarter of 2024, as the 30-year fixed mortgage rate ranged from 6.82% to 7.22%, according to the National Association of Realtors' latest quarterly report released on Aug. 13.
Thirteen percent of the 223 tracked metro areas experienced double-digit price gains over the same period, down from 30% in the first quarter. The median single-family existing-home price for the San Jose, CA metro area was $2,008,000—it's the first time since NAR began tracking metro area single-family home prices in 1979 that a metro area's median price exceeded $2 million.
Two market areas that make up the New York metro region—New York-Jersey City-White Plains, NY-NJ (No. 7) and Dutchess County-Putnam County, NY (No. 9)—ranked among the top 10 metro areas for price increases in the second quarter.
“The record-high home prices in most metro markets bring good and bad news,” said NAR Chief Economist Lawrence Yun. “It's terrific news for homeowners who are moving ahead in wealth gains. However, it's difficult for those wanting to buy a home as the required income to qualify has roughly doubled from just a few years ago.”
Compared to one year ago, the national median single-family existing-home price grew 4.9% to $422,100. In the previous quarter, the year-over-year national median price increased 5%.
Among the major U.S. regions, the South registered the largest share of single-family existing-home sales (45.5%) in the second quarter, with year-over-year price appreciation of 2.3%. Prices also bounced 9.8% in the Northeast, 5.5% in the Midwest and 5.4% in the West.
The top 10 metro areas with the largest year-over-year median price increases, which can be influenced by the types of homes sold during the quarter, all posted gains of at least 14.1%. Five of the markets were in the Northeast. Overall, those markets were Racine, Wis. (19.8%); Glens Falls, NY (19.8%); El Paso, TX (19.2%); Morristown, TN (16.7%); Manchester-Nashua, NH (16.2%); Anaheim-Santa Ana-Irvine, CA (15.0%); New York-Jersey City-White Plains, NY-NJ (14.8%); Springfield, IL (14.8%); Dutchess County-Putnam County, NY (14.2%); and Trenton, NJ (14.1%).
Seven of the top 10 most expensive markets in the U.S. were in California. Overall, those markets were San Jose-Sunnyvale-Santa Clara, CA ($2,008,000; 11.6%); San Francisco-Oakland-Hayward, CA ($1,449,000; 8.5%); Anaheim-Santa Ana-Irvine, CA ($1,437,500; 15%); Urban Honolulu, HI ($1,101,500; 3.8%); San Diego-Carlsbad, CA ($1,050,000; 11.4%); Salinas, CA ($1,035,700; 13.1%); Oxnard-Thousand Oaks-Ventura, CA ($927,900; 2.5%); San Luis Obispo-Paso Robles, CA ($895,300; 0.5%); Boulder, CO ($888,300; 2%); and Naples-Immokalee-Marco Island, FL ($867,000; 2%).
Nearly 10% of markets (22 of 223) experienced home price declines in the second quarter, up from 7% in the first quarter.
“Previously fast-gaining markets took a breather in the past quarter, including Nashville, Durham, Austin, and several Florida metro areas,” Yun said. “Conversely, some markets that experienced declines last year have roared back, such as San Francisco, Anaheim, and New York.”
Housing affordability worsened in the second quarter as mortgage rates increased. The monthly mortgage payment on a typical existing single-family home with a 20% down payment was $2,262, up 11.1% from the first quarter ($2,036) and 10.3%—or $212—from one year ago. Families typically spent 26.5% of their income on mortgage payments, up from 24.2% in the previous quarter and 25.3% one year ago.
First-time buyers encountered limited inventory and rising home prices in the second quarter, resulting in deteriorated affordability conditions compared to the prior quarter. For a typical starter home valued at $358,800 with a 10% down payment loan, the monthly mortgage payment jumped to $2,218, up 11.1% from the previous quarter ($1,997). That was an increase of $207, or 10.3%, from one year ago ($2,011). First-time buyers typically spent 40% of their family income on mortgage payments, up from 36.5% in the prior quarter.
A family needed a qualifying income of at least $100,000 to afford a 10% down payment mortgage in 48% of markets, up from 40.7% in the previous quarter. Yet, a family needed a qualifying income of less than $50,000 to afford a home in 2.7% of markets, down from 4.5% in the prior quarter.
“Housing affordability will improve in upcoming months,” Yun said. “Mortgage rates have fallen measurably, and more supply is reaching the market. Therefore, the income required to buy a home will decrease.”

Receive original business news about real estate and the REALTORS® who serve the lower Hudson Valley, delivered straight to your inbox. No credit card required.